.jpg)
As everyone is switching to Google Analytics 4, we at Dropsolid provide comprehensive GA4-training to get started with the tool. Due to the significant differences between Universal Analytics and GA4 (interface and metrics), we have noticed that certain questions keep coming up in each training. We’d like to answer them for you too:
- My data from UA doesn't match what I'm seeing in GA4
- I used to look at the bounce rate, which is no longer available. What is the engagement rate?
- We used views to see data per language. How should we do that now?
- I'd like to share some of the data with specific colleagues, as we used to do with views
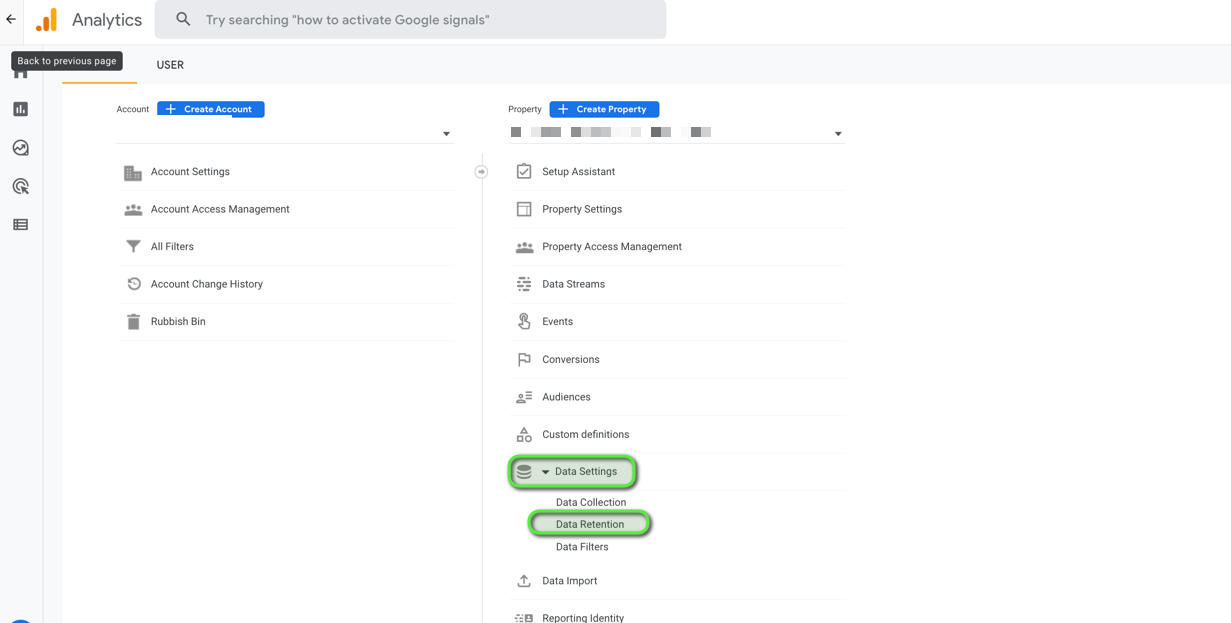
- My explore reports have a very limited date range
- Can I share my custom reports so that my colleagues can also use it?
- How can I see on which page events occurred?
1. My data from UA doesn't match what I'm seeing in GA4
One of the biggest differences between UA and GA4 is how they measure data. GA4 uses event-based tracking, while UA works on a session-based approach. In Universal Analytics, sessions are effectively measured based on certain parameters, whereas GA4 estimates the number of sessions.
Some statistics should be relatively close to each other, while other metrics may show a larger difference. Google has also published an article comparing statistics in UA and GA4.
It's important to never interpret the numbers as absolute figures. You can never have 100% of all data because some people refuse or block tracking cookies. Look for trends to draw conclusions and use abnormal spikes to check if something is wrong with the website or tracking setup.
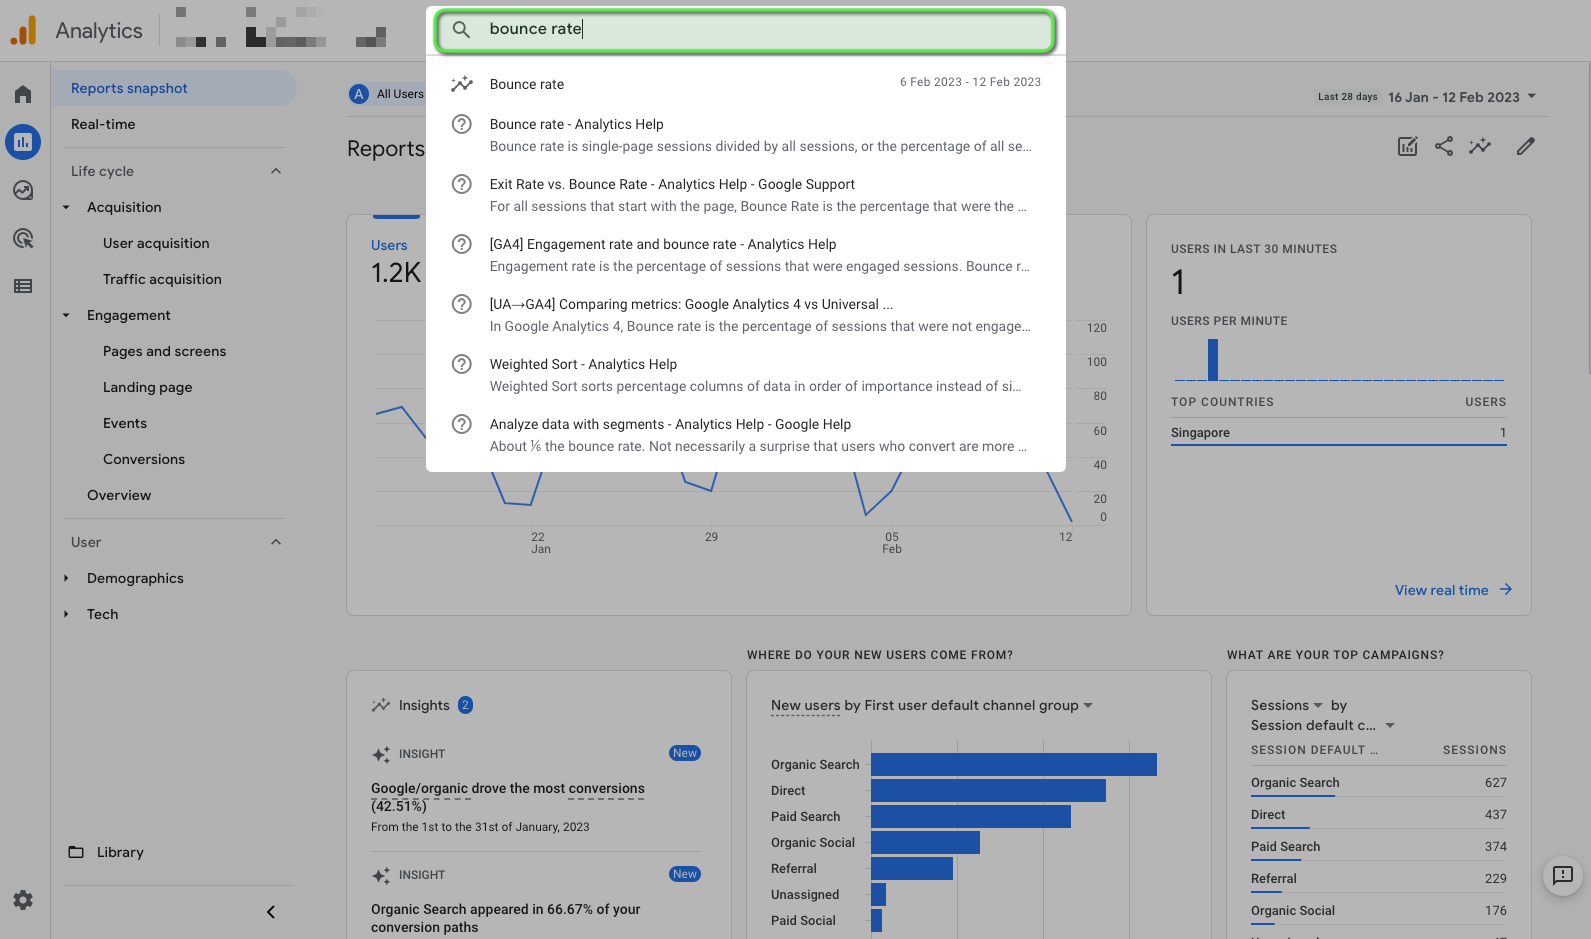
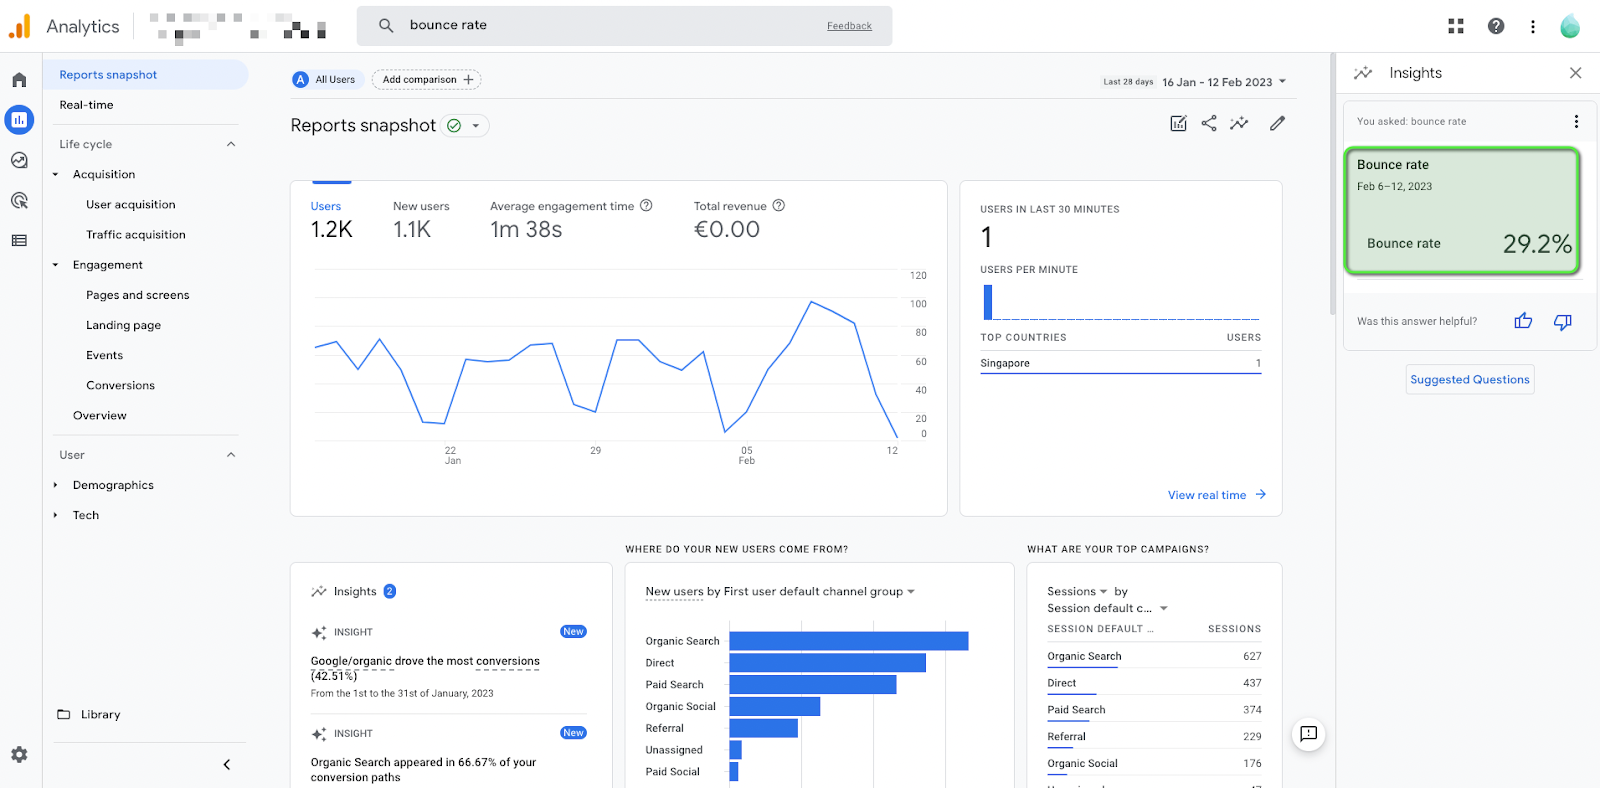
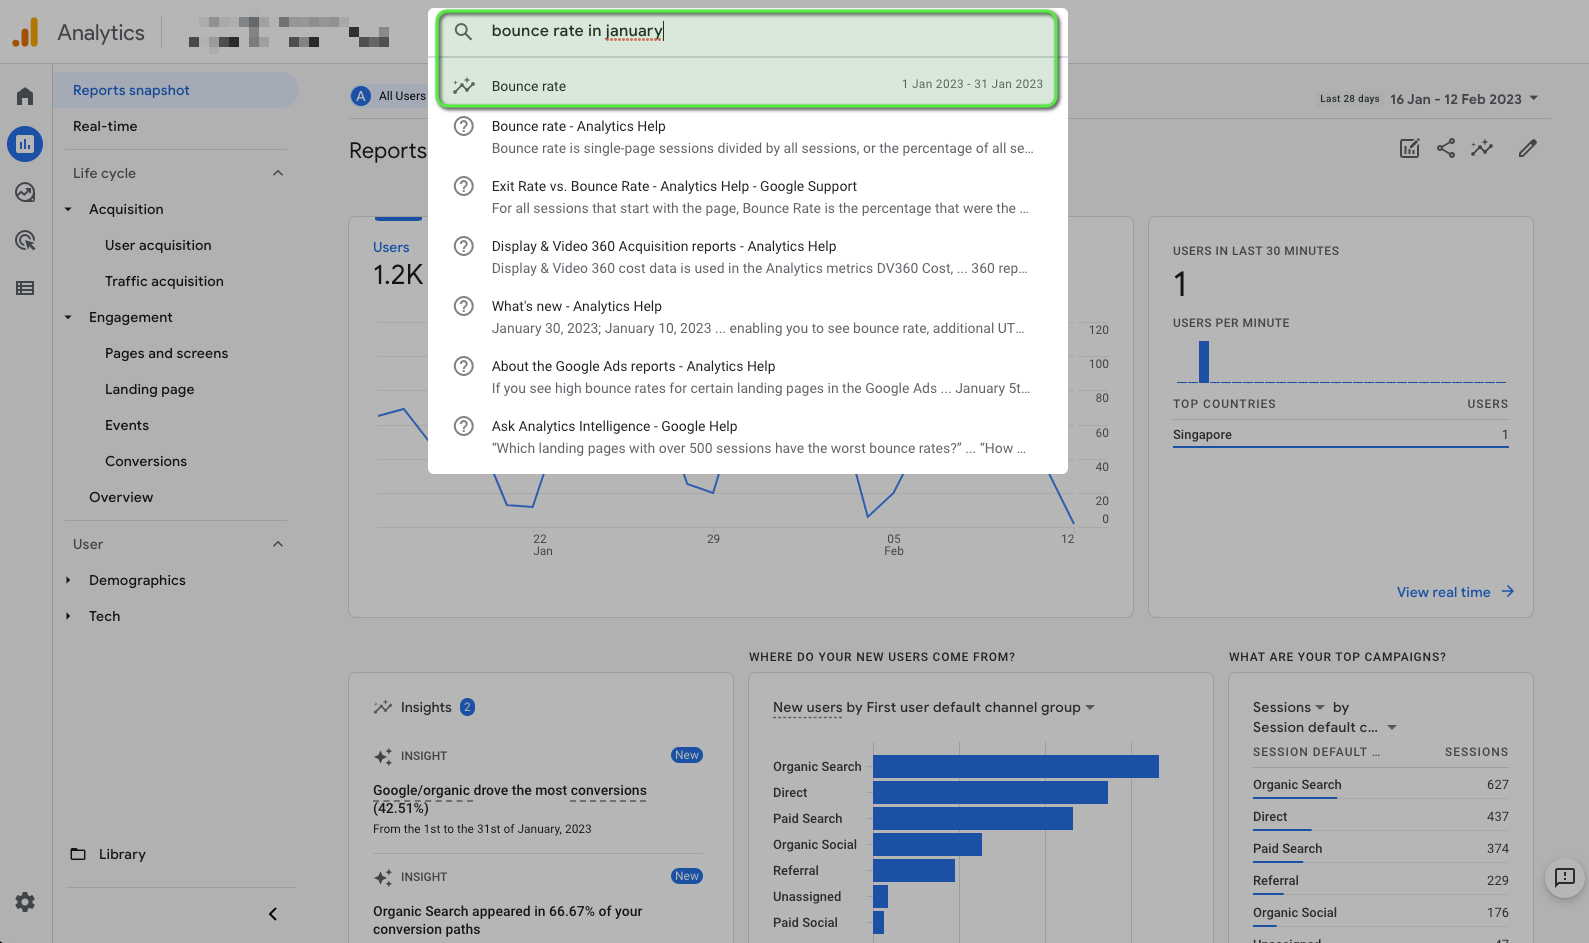
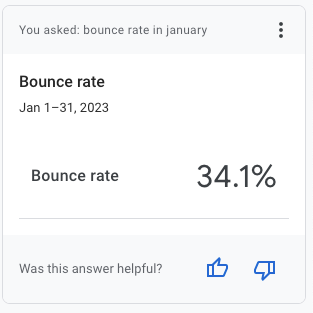
2. I used to look at the bounce rate, which is no longer available. What is the engagement rate?


3. We used views to see data per language. How should we do that now?
In Universal Analytics, each account consisted of one or more properties, which in turn could have one or more views. Many companies used those views to break down website data by language. In Google Analytics 4, those views no longer exist. If you want to see the data by language, there are several options:
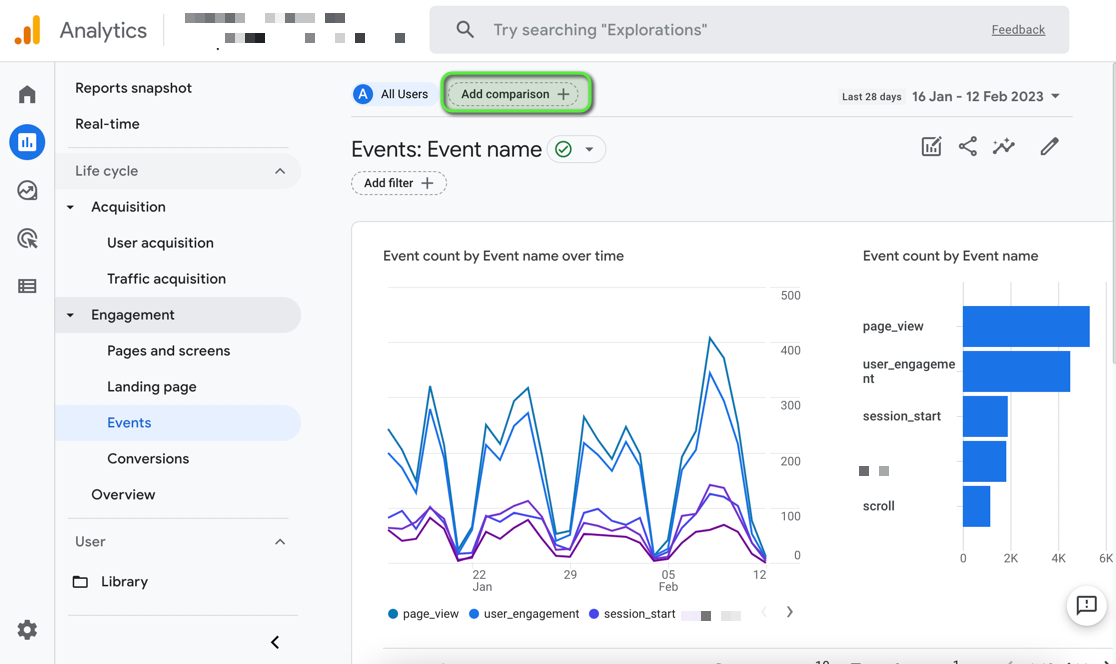
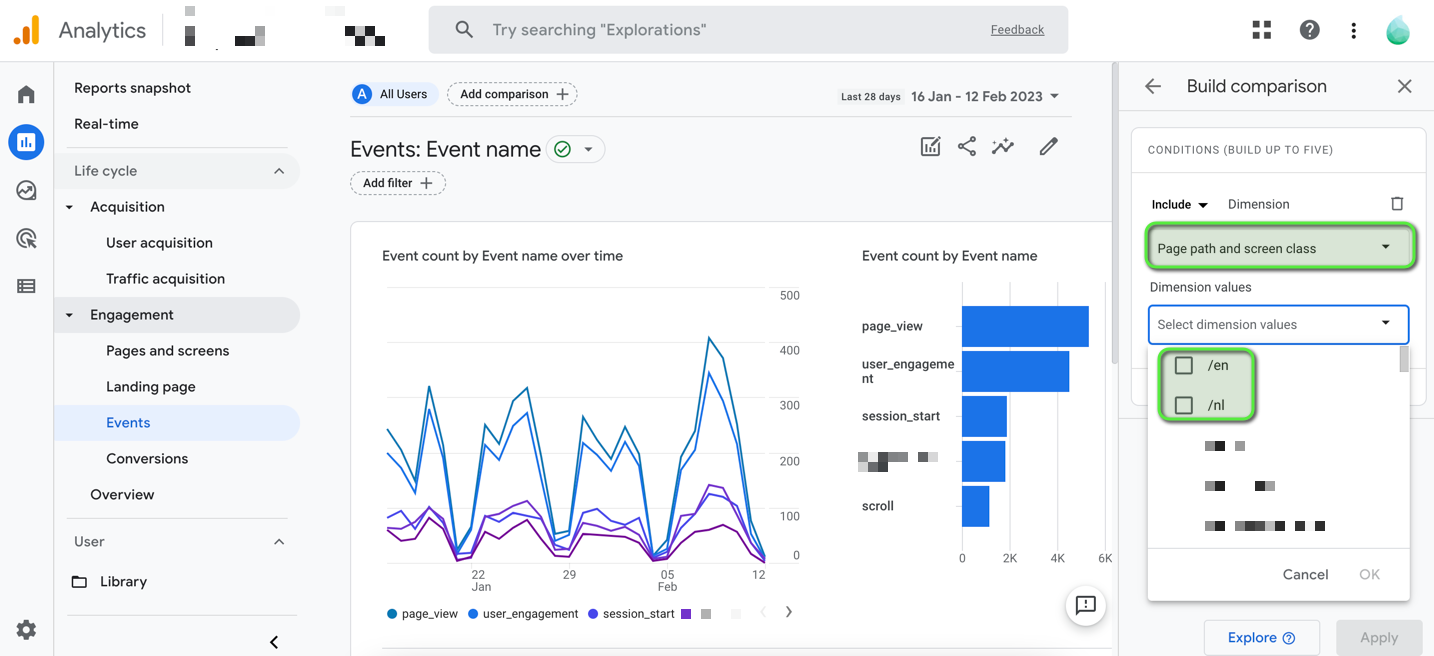
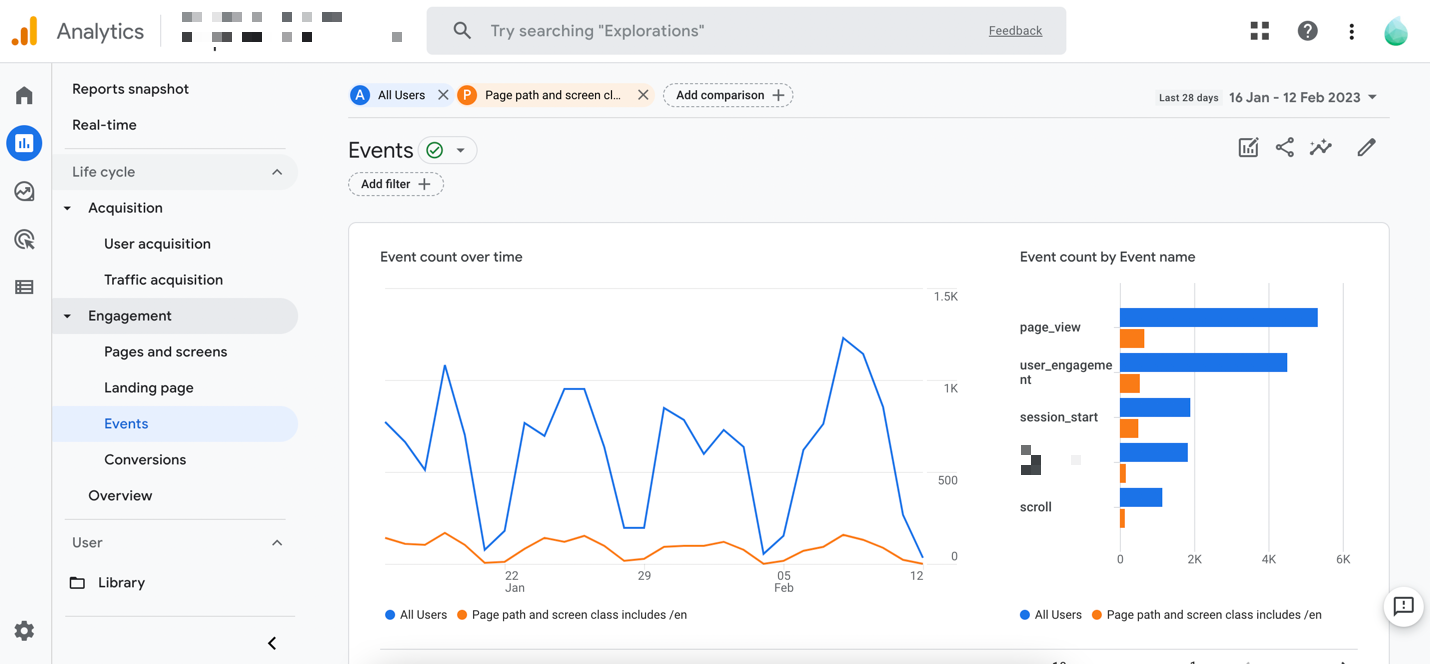
- Quick comparison? Add a comparison to the report.
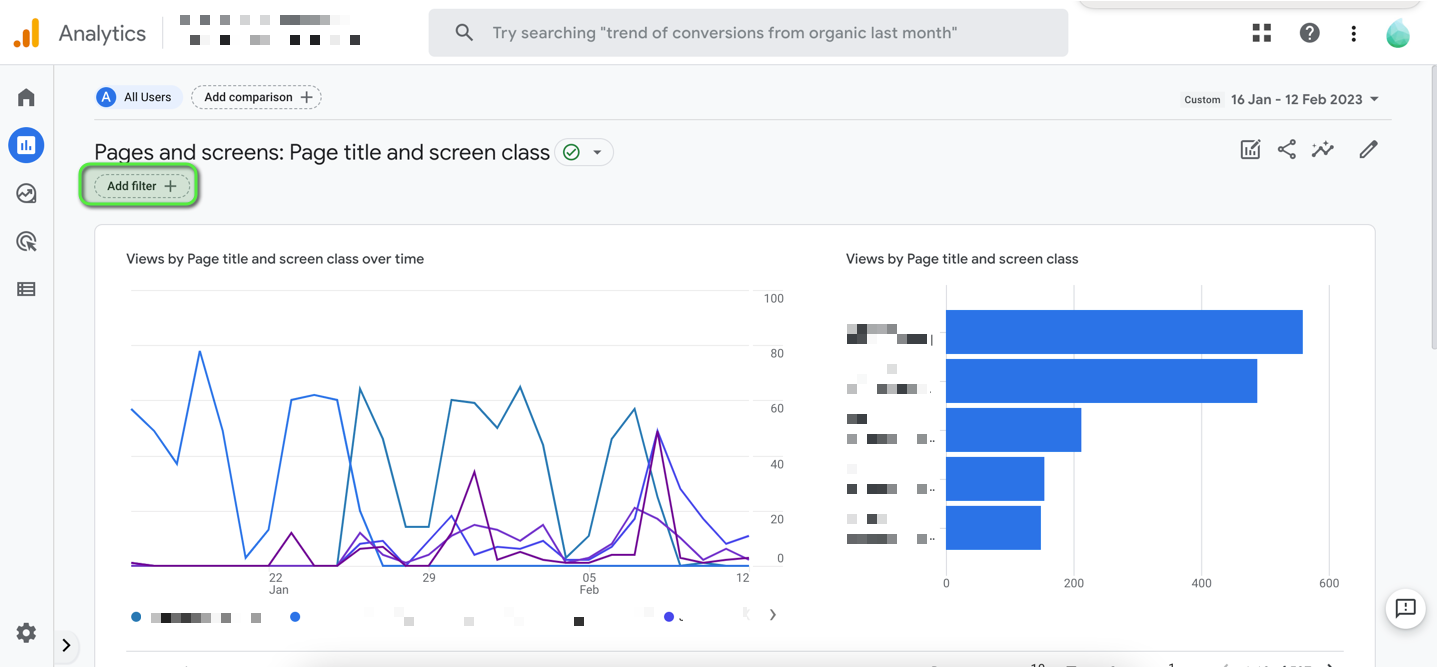
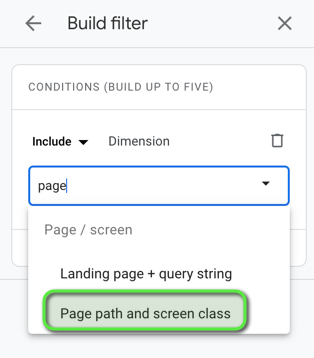
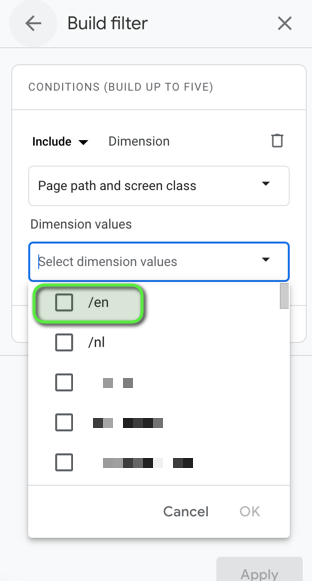
- Want to see only specific language? Use a filter.
- Looking for a long-term solution, so you don't have to add that comparison or filter every time?
- Create a custom explore report with a fixed segment.
- Create a custom standard report with a fixed filter.
Comparison


Filter

Custom reports
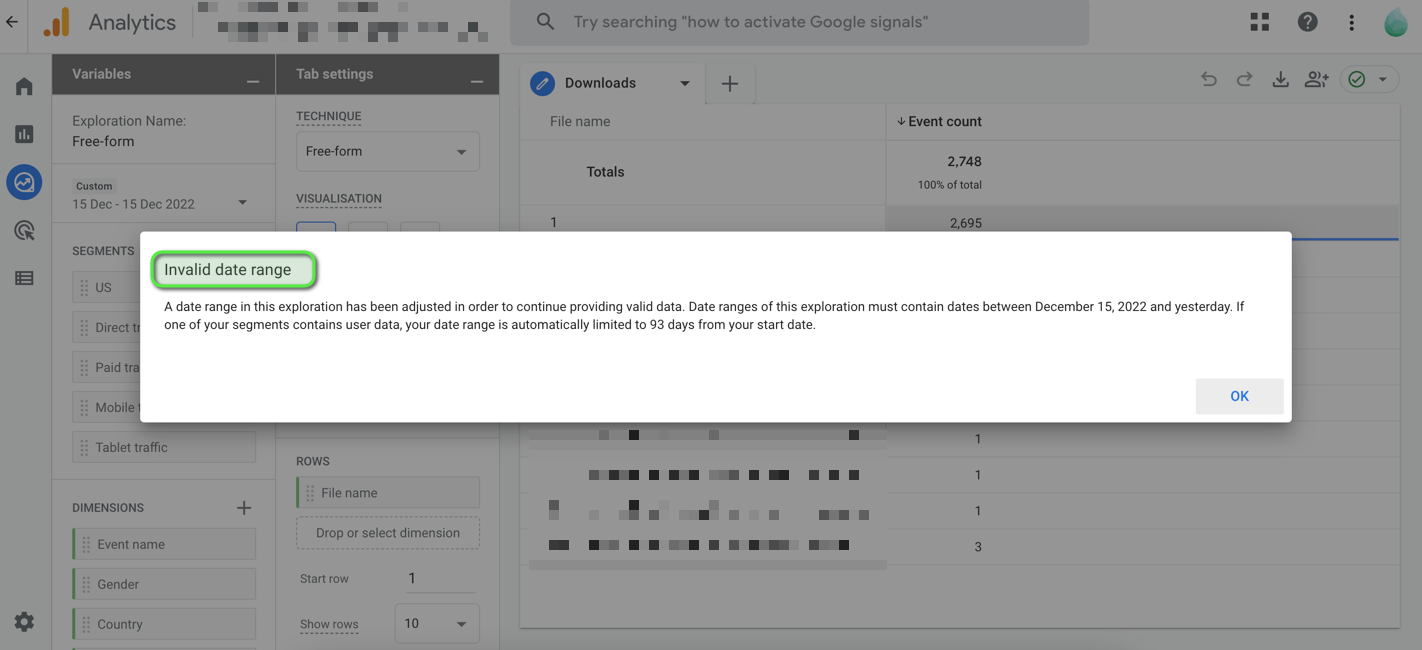
In the Explore reports, you can create a custom report with dimensions and metrics for each language. By setting up a fixed segment here, you can go to this "filtered" report in one click. The disadvantage is that you cannot consult all historical data (see question 7). To prevent this, you can also add a custom "standard" report with a predefined filter.
During our GA4 training, we will teach you how to create both reports. Interested?
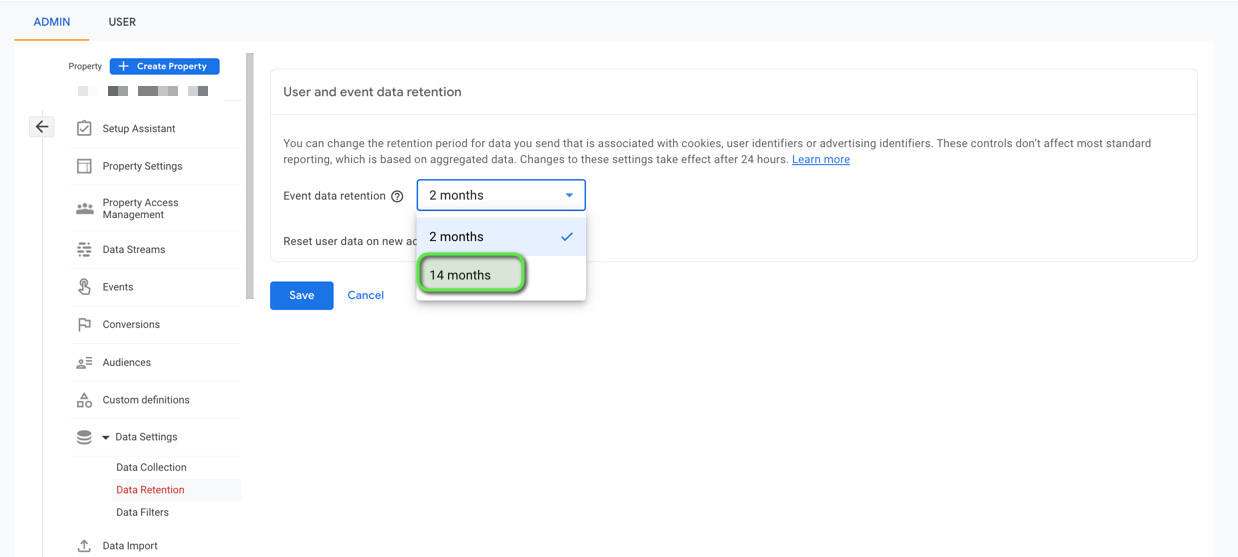
5. My explore reports have a very limited date range


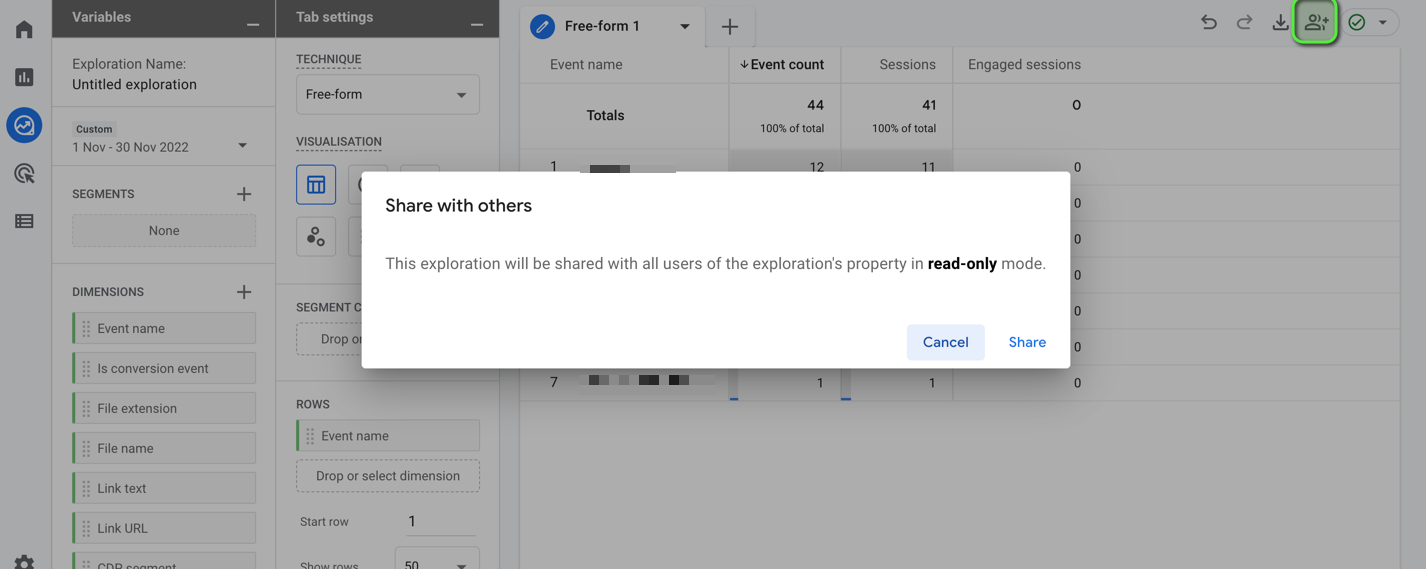
6. Can I share my custom reports so that my colleagues can also use it?

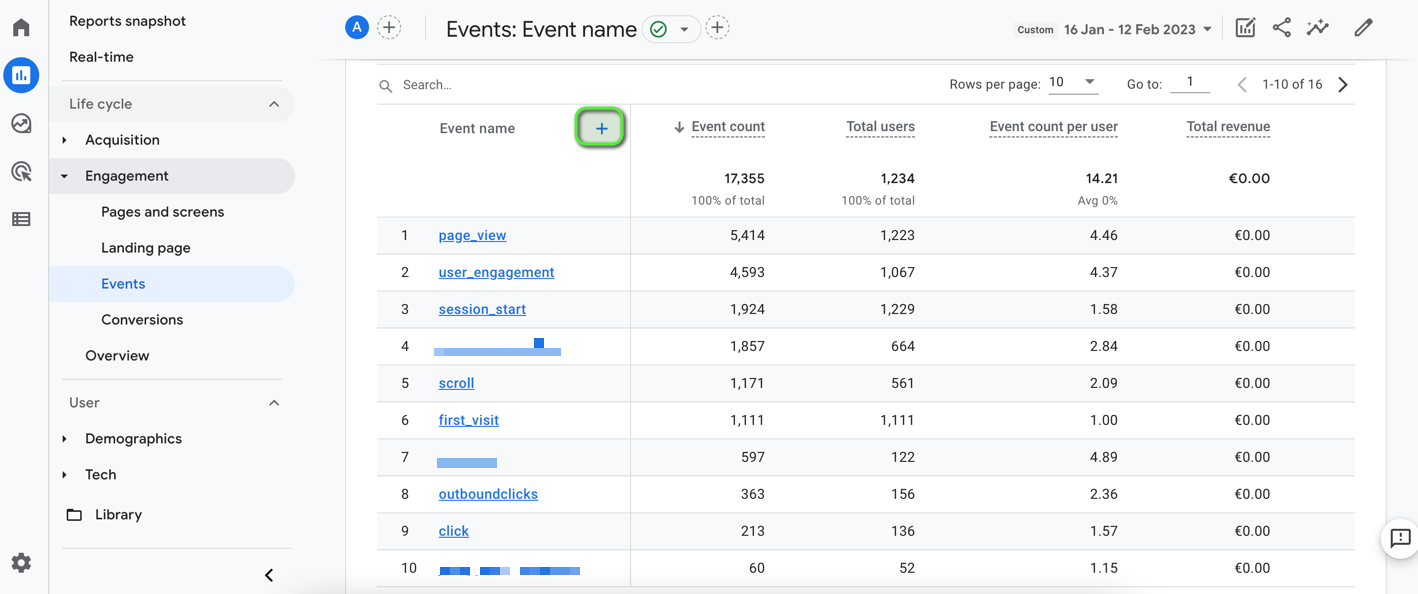
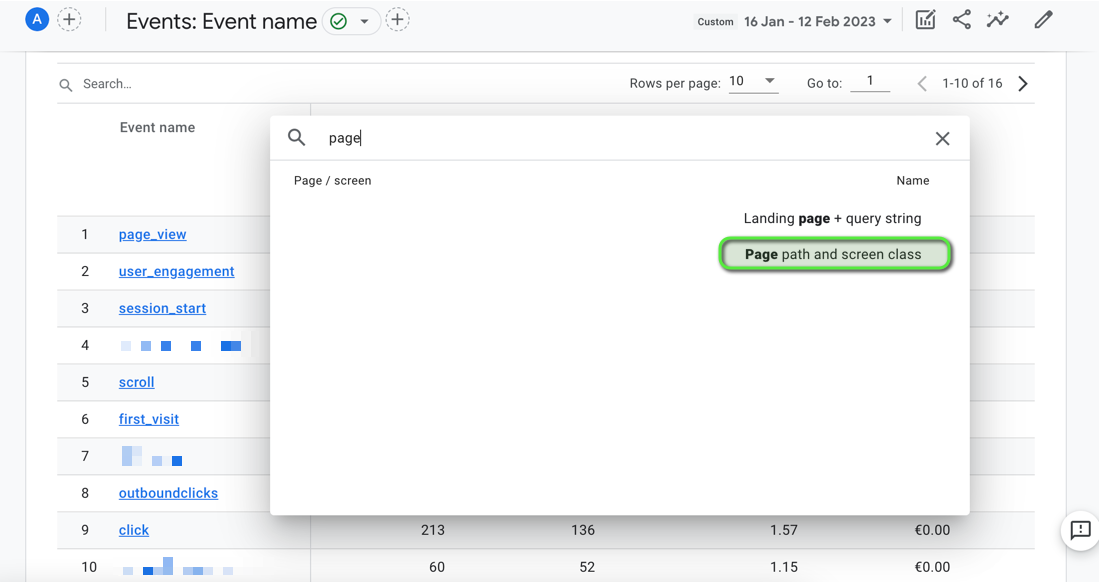
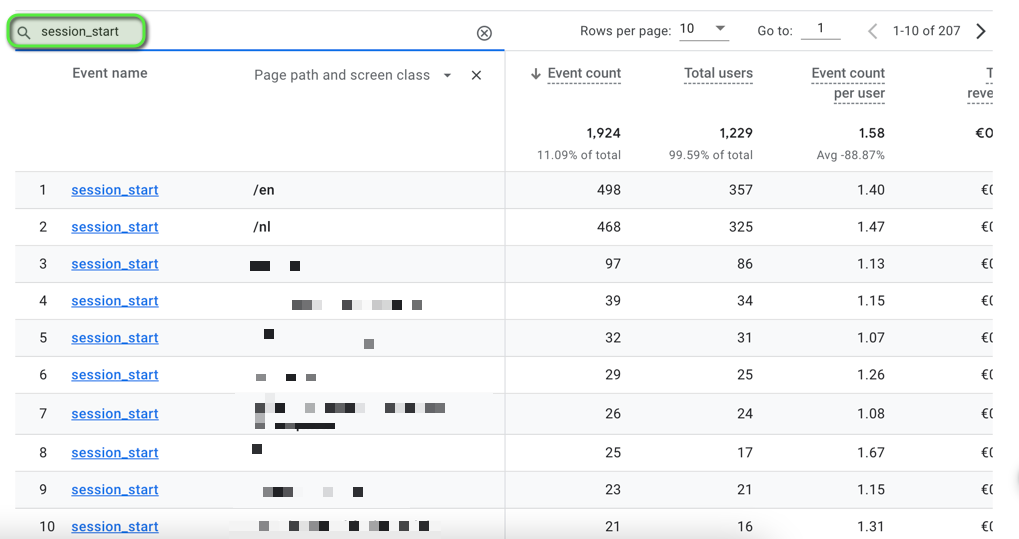
7. How can I see on which page events occurred?


Need help? Let me know!
Having trouble with the new features in Google Analytics 4 or don't know where to start? Our experts are here to help! We offer a comprehensive Google Analytics 4 training course that will prepare you and your team to dive into GA4.
