7 recurring questions from our Google Analytics 4 (GA4) trainings

Blog
Posted on
GA4 learnings

1. My data from UA doesn't match what I'm seeing in GA4

One of the biggest differences between UA and GA4 is how they measure data. GA4 uses event-based tracking, while UA works on a session-based approach. In Universal Analytics, sessions are effectively measured based on certain parameters, whereas GA4 estimates the number of sessions.

Some statistics should be relatively close to each other, while other metrics may show a larger difference. Google has also published an article comparing statistics in UA and GA4.

It's important to never interpret the numbers as absolute figures. You can never have 100% of all data because some people refuse or block tracking cookies. Look for trends to draw conclusions and use abnormal spikes to check if something is wrong with the website or tracking setup. 

2. I used to look at the bounce rate, which is no longer available. What is the engagement rate?

First things first: in the meantime, the bounce rate is available again in GA4. However, it is not yet included in the standard reports. If you want to check the bounce rate, you can use the search bar at the top to access it.

Google Analytics 4 bounce rate

On the right-hand side, an "insights" tab opens up showing the bounce percentage of the last 7 days.

Google Analytics 4  bounce percentage

If you want to see the bounce rate for a specific period, you can modify the search term. For example, "Bounce rate in January".

Google Analytics 4 bounce rate

Google provides the following definition for engagement rate: "The percentage of sessions that were engaged sessions." An engaged session is defined as: "The number of sessions that lasted for 10 seconds or longer, or generated one or more conversion events or two or more screen views."

Side note: 10 seconds is quite short and doesn't necessarily indicate real engagement. If desired, this setting can be adjusted and increased to any duration between 10 and 60 seconds.

The bounce rate is the percentage of sessions that were not engaged sessions. The bounce rate is the opposite of the engagement rate.

While you want to have the bounce rate as low as possible, you want to have the highest possible engagement rate. And that's included in all standard reports.

Google Analytics 4 bounce rate

3. We used views to see data per language. How should we do that now?

In Universal Analytics, each account consisted of one or more properties, which in turn could have one or more views. Many companies used those views to break down website data by language. In Google Analytics 4, those views no longer exist. If you want to see the data by language, there are several options:

  • Quick comparison? Add a comparison to the report.
  • Want to see only specific language? Use a filter.
  • Looking for a long-term solution, so you don't have to add that comparison or filter every time?
    1. Create a custom explore report with a fixed segment.
    2. Create a custom standard report with a fixed filter.

Comparison

Here, you create a segment based on the page paths that contain a specific language parameter, as shown in this example.

Google Analytics 4 comparison

If you do this, you will see a second color added to your report for this segment, allowing you to compare.

The convenient thing is that this segment is also carried over to the other standard reports throughout your session. This means that you can compare and view all data. However, when you close your browser window, the comparison will be removed, so you'll need to add the comparison again during your next visit unless you save it as a default segment in an Explore report.

Google Analytics 4 comparison

Filter

Option 2 is adding a filter. 

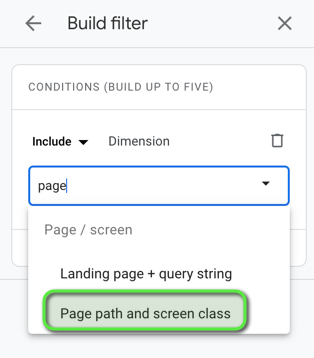
Google Analytics 4 filter

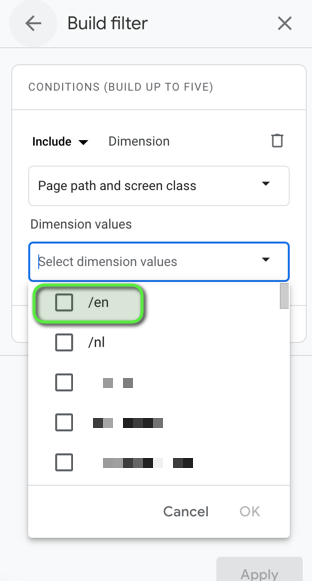
The process of creating a filter works in the same way as setting up a comparison. You choose the dimension based on which you want to set up the filter and then select the desired value by checking the corresponding box.

Google Analytics 4 filter

Custom reports

In the Explore reports, you can create a custom report with dimensions and metrics for each language. By setting up a fixed segment here, you can go to this "filtered" report in one click. The disadvantage is that you cannot consult all historical data (see question 7). To prevent this, you can also add a custom "standard" report with a predefined filter.

During our GA4 training, we will teach you how to create both reports. Interested?

Take a look at the training page

4. I'd like to share some of the data with specific colleagues, as we used to do with views

In GA4, views no longer exist. This means that all data in your property is fully visible to anyone with access to the property. If you want to share only a portion of the data, such as for a specific region or the pages of a specific department, you need a workaround:

  • Either you create a separate property that only contains that data. We don't really recommend this as it also has a separate tracking code and requires extra setup.
  • A better option is to use an external dashboard that already has a filter on it. This can be a Looker Studio dashboard, but there are also other options. Looker Studio dashboards are interactive and very accessible but have some limitations since November 2022.

Our experts are ready to help you if you're interested in dashboards or want to explore the possibilities further.

5. My explore reports have a very limited date range

If you previously created an explore report and revisit it, you may encounter the "Invalid date range" error.

Google Analytics 4 invalid date range

When a GA4 property is created with default settings, most explore reports can only be viewed for a date range of up to 2 months in the past.

You can adjust this in your property settings. Navigate to the "Data settings" and then to "Data Retention" settings. Here, you can adjust the timeframe from 2 months to 14 months.

Google Analytics 4 date range

6. Can I share my custom reports so that my colleagues can also use it?

An explore report is by default only accessible to the person who created it. However, you can share the report with anyone who has access to the property. This is read-only access, which means that others cannot make any changes to the report.

Colleagues who want to edit the report need to make a copy so they become the owner themselves. If you want to approach this differently, it's best to use a shared email address to log in to your Google Analytics account.

Google Analytics 4 read only

7. How can I see on which page events occurred?

A quick way to do this is by using a secondary dimension on the event report with a quick filter. Note that "quick" is important here, as switching to another report or clicking through will reset it. For a long-term overview, a custom report or external dashboard is a better option.

To add a secondary dimension, click on the plus icon above the table and search or select the desired dimension. To make the list of events and corresponding pages more manageable, enter the event you want to analyze in the search bar above the table.

Google Analytics 4 events

Need help? Let me know!

Having trouble with the new features in Google Analytics 4 or don't know where to start? Our experts are here to help! We offer a comprehensive Google Analytics 4 training course that will prepare you and your team to dive into GA4.

Wouter en Tina

Need help with GA4?